
Algorithmic Trading
- Kunal Patil

- Apr 24, 2021
- 4 min read
Updated: Apr 28, 2021
I'm building an algorithmic trading bot which sends me text updates to purchase and sell securities from the stock market. Why?
I want to learn more Python.
I want to combine my interests in stocks and algorithms.
I want to make money while I play with my dog.
After back testing the algorithm with historical market data and finding results of favorable profits, I plan to use the bot for live-trading with real money. Keeping in mind that I will eventually use real money, I intend to make a successful trading algorithm, and due to its nature, will not be going into specific implementation details.
Topics covered in this blog post:
Paper trading with the Alpaca API
Technical indicators used in financial analysis
Web scraping Invesco's holding data
Calculating indicators from scraped data
What is Paper Trading?
A paper trade is a simulated trade that allows an investor to practice buying and selling without risking real money. The term dates back to a time when (before the proliferation of online trading platforms) aspiring traders would practice on paper before risking money in live markets. While learning, a paper trader records all trades by hand to keep track of hypothetical trading positions, portfolios, and profits or losses. Today, most practice trading involves the use of an electronic stock market simulator, which looks and feels like an actual trading platform.
Alpaca API
Alpaca is the perfect service for this application because it provides an easy to use, commission-free stock trading API that can be used for both live and paper trading. Paper trading accounts start off with $100,000.00 equity and $400,000.00 buying power. I used Alpaca's documentation to stream real-time stock market data, get OHLC (open, high, low, close) values, and place market orders.
Documentation
- Streaming - Read in market data in real-time
- Bars - Get open, high, low, closing values
- Orders - Purchase or liquidate securities
Technical Indicators
Technical indicators are heuristic or pattern-based signals produced by the price, volume, and/or open interest of a security or contract used by traders who follow technical analysis.
By analyzing historical data, technical analysts use indicators to predict future price movements. Examples of common technical indicators include the Relative Strength Index, Moving Average, and MACD.
RSI (Relative Strength Index)
RSI is a momentum indicator used in technical analysis that measures the magnitude of recent price changes to evaluate overbought or oversold conditions. The RSI is displayed as an oscillator (a line graph that moves between two extremes) and can have a reading from 0 to 100.

Traditional Interpretation:
RSI of 70 or above indicates that a security is becoming overbought.
Overbought: Market price speculated to fall
RSI of 30 or below indicates that a security is becoming oversold.
Oversold: Market price speculated to rise
MA (Moving Average)
By calculating the moving average, the impacts of random, short-term fluctuations on the price of a stock over a specified time-frame are mitigated. The moving average smooths out the price data over a specified period of time by creating a constantly updated average price.
Interpretation:
A rising moving average indicates that the security is in an uptrend
A declining moving average indicates that the security is in a downtrend
While calculating moving averages are useful in their own right, the calculation can also form the basis for other technical analysis indicators, such as the moving average convergence divergence (MACD).
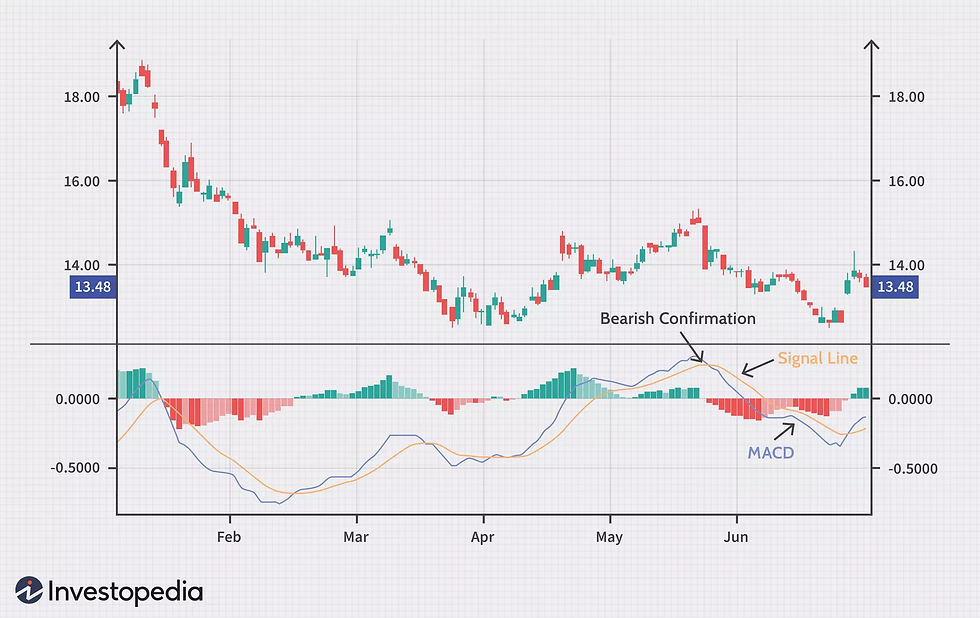
MACD (MA Convergence Divergence)
Upward momentum is confirmed with a bullish crossover, which occurs when a short-term moving average crosses above a longer-term moving average.

Downward momentum is confirmed with a bearish crossover, which occurs when a short-term moving average crosses below a longer-term moving average.
Web Scraping Invesco's Holdings
Before we can do any technical analysis, we need to get a list of symbols from the US stock market. We will use this list to make requests to the Alpaca API which will respond with OHLC data for each symbol.
Python Example
# Go to Invesco and download qqq holding data
url = 'https://www.invesco.com/us/financial-products/etfs/holdings/main/holdings/0?audienceType=Investor&action=download&ticker=QQQ'
r = requests.get(url, allow_redirects=True)
open('data/qqq.csv', 'wb').write(r.content)

# Get a list of stock symbols
holdings = open('data/qqq.csv').readlines()
symbols = [holding.split(',')[2].strip() for holding in holdings][1:]
symbols = ",".join(symbols)
By sending the stock symbol as a GET request to Alpaca API, we get a response with OHLC (open, high, low, close) data for the desired stock. This data is then used to calculate technical indicators.
# This code snippet gets OHLC data of the most recent 1000 days.
# However, Alpaca also provides minute-by-minute values.
days_bars_url = '{}/day?symbols={}&limit=1000'.format(config.BARS_URL, symbols)

r = requests.get(days_bars_url, headers=config.HEADERS)

data = r.json()

# Each stock gets its own .txt data file
for symbol in data:
    filename = 'data/ohlc/{}.txt'.format(symbol)
    f = open(filename, 'w+')
    f.write('Date, Open, High, Low, Close, Volume, Open Interest\n')

 for bar in data[symbol]:
        t = datetime.fromtimestamp(bar['t'])
        day = t.strftime('%Y-%m-%d')
        line = '{}, {}, {}, {}, {}, {}, {}\n'.format(day, bar['o'], bar['h'], bar['l'], bar['c'], bar['v'], 0.00)
        f.write(line)
Calculating Indicators
The bta-lib (backtrader technical analysis) library provides functions to calculate common technical indicators. It is a pandas-based library focused on being re-usable and easy to use for developing and experimenting with new indicators. Documentation: https://github.com/mementum/bta-lib
Python Example
import btalib
import pandas as pd
# Read Apple's scraped data into a pandas dataframe
df = pd.read_csv('data/ohlc/AAPL.txt', parse_dates=True, index_col='Date')
# Calculate simple moving average and relative strength index
sma = btalib.sma(df, period=5)
rsi = btalib.rsi(df)
# Store values in our dataframe
df['sma'] = sma.df
df['rsi'] = rsi.df
# Shows the relationship between long and short term moving averages
macd = btalib.macd(df)
# Store values in our dataframe
df['macd'] = macd.df['macd']
df['signal'] = macd.df['signal']
df['histogram'] = macd.df['histogram']
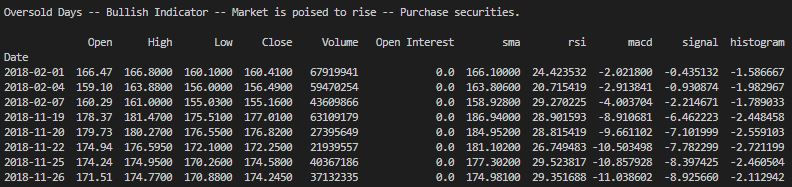
# Bullish indicator: Market is poised to rise
oversold_days = df[df['rsi'] < 30]
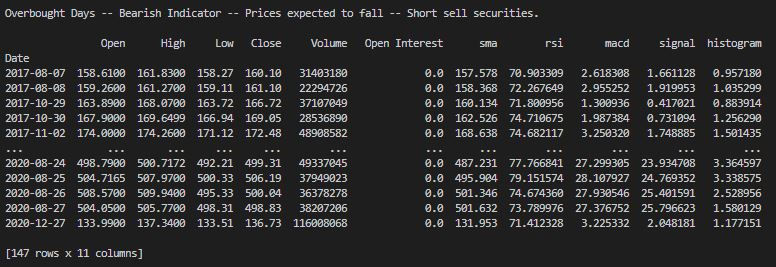
# Bearish indicator: Prices expected to fall
overbought_days = df[df['rsi'] > 70]
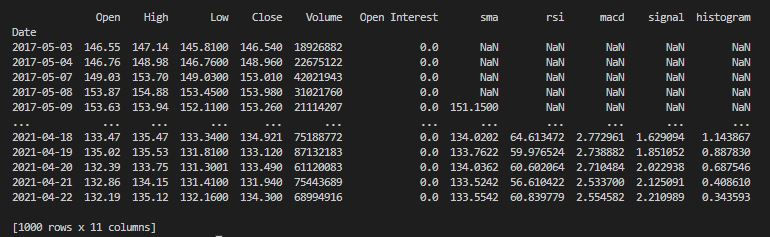
Python Output
Dataframe
Overbought Days
Oversold Days
That's a lot of numbers. Now let's take a step back. What we know:
- We know how to stream stock data by the minute with the Alpaca API
- We know how to calculate technical indicators from streamed data
- We know how to traditionally determine if a stock is overbought or oversold
- We know how to place orders with real or paper money with the Alpaca API
We now have a basic trading bot to buy and sell securities from the US stock market! The difference is that my trading bot does not use the traditional (30/70) rsi values for its trading algorithm. It is much more complex, varying by the stock, time of year, overbought and oversold thresholds, and includes weights of technical indicators... but that's my personal implementation. Let's see what you can come up with!


Comments